Business analytics is very important to any goal-driven company. It involves the process of analyzing historical data using technologies and statistical methods to obtain new insights and improve strategic decision-making.
Some companies feature so many departments hence, there is a need for a unified analytics dashboard that draws data from all available sources.
SAS and Power BI are two very good options if you’re looking for good business analytics software. Both software programs are used by many companies in data management and analysis.
This article aims to know which is better between the two – Power BI or SAS.
So, let’s get started with the SAS vs Power BI showdown.
What Is SAS?

SAS is described as an analytics, artificial intelligence, and data management software; it’s a part of the SAS suite. This software developed by the SAS Institute was initially released in 1976. However, its stable release was recent, in August 2020.
It is built for companies, statisticians, forecasters, business analysts, data scientists, and anyone who works with data. SAS is very popular among enterprise-level companies.
The software supports two to more than a thousand users so it’s suitable for small, medium, and large organizations. SAS Visual Analytics is premium software but you can use it free on trial before subscribing.
Furthermore, it’s a proprietary data analytics software compared to Power BI which is open source.
What Is Power BI?

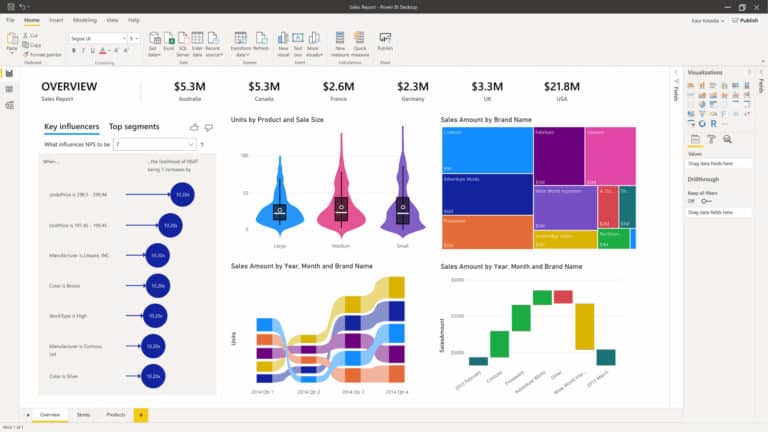
Power BI is a business analytics software from Microsoft which was released in July 2011. You’ll find it as part of the Microsoft Power Platform. Power BI aims to make business intelligence and data visualizations easy to create.
Hence, this software is most popular among starters. There are prebuilt and custom data connectors. Anyone at any level in your organization can make better business decisions using reliable analytics from Microsoft Power BI.
Power BI has AI capabilities that provide smart insights. It works seamlessly with Excel from the Microsoft Office Suite which is another powerful data analysis program.
Deployment And Installation
SAS

Deployment with SAS is simple thanks to the SAS Deployment manager. This deployment manager is a GUI and it includes the SAS Deployment Wizard that works you through the entire process.
You can deploy SAS on cloud, web-based, and SaaS applications. The software works on Windows and Linux desktop platforms. You can deploy it on-premise on both operating systems.
Installation involves downloading the SAS Software Depot Archive file, extracting, and running the setup file. Extracting the installation file could take time.
Power BI

As a Microsoft product, you can only deploy Power BI to Windows on a desktop system. It doesn’t support other operating systems like Linux and Mac. Nevertheless, you can deploy the business analytics software to cloud, SaaS, and web-based solutions.
Installing Power BI is just like installing any other Windows desktop software. You can download the software from the Microsoft website and run the setup.exe file. There are on-premise versions for standard and personal modes as well.
Verdict
With support for Linux, SAS supports more platforms than Power BI.
BI Reporting
SAS

The SAS software has useful features for BI standard reporting. First of all, you can explore visual data for quick insights. These visual data features automated analysis and natural language explanations.
It’ll be very easy for you to pinpoint the metrics that matter most. This includes your business expectations, future trends, outcomes, etc.
With SAS, you can easily personalize your BI reports. There are self-service tools for data access, mashup, filtering, and data transformation amongst others. Anyone can easily create and manage their own BI content.
Power BI
For BI reporting, A Power BI report takes a multi-perspective look at your dataset. The report comes with visualizations representing various metrics and insights from your company’s data.
Power BI reports can be just a single page visual or multiple visuals on multiple pages. You can edit and personalize your data without worrying about affecting the original dataset. Hence, the software provided enough room to explore.
You can access BI reports you create or those shared with you by others.
Verdict
BI reporting isn’t much different on SAS and Power BI.
Ad-hoc Reporting
SAS

If you’ve created a SAS report program already, then, you can easily create an ad hoc report. The difference is that you won’t be uploading any new files to the SAS content server.
You can create an ad-hoc report by selecting the Ad Hoc option when creating New Reports from the Reports tab. The software requires that you provide a SAS code, so you must first create a SAS report program.
After entering your code and every other required info, you can then run your ad-hoc report.
Power BI

Power BI supports ad-hoc reporting. The software lets you create an ad-hoc report linking several data types. Most Power BI beginners create their first report using ad-hoc.
To start with, you must have your data sources ready. This could be a CSV or SQL server file amongst others. Import the data into your Power BI dashboard and you can then proceed to create your ad hoc report.
However, the software won’t automatically set up the charts for you. The software won’t automatically set up the charts for you. You have to do that manually.
Verdict
From user experiences, ad-hoc reporting is easier with SAS than with Power BI.
Data Discovery
SAS

SAS features an exclusive tool for data discovery – the SAS Visual Data Discovery tool. This tool features different other SAS products including Base SAS, SAS/GRAPH, and SAS/STAT. It also features two interfaces, the SAS Enterprise Guide and the JMP Software.
You can use the SAS Enterprise Guide for batch analysis and guided tasks while you can use the JMP Software for discovery and exploratory analysis. With these tools, you can perform simple to very complex data discovery tasks.
Power BI

With Power BI, you can perform automatic data discovery tasks. If you have a new dataset, you can run quick insights to generate visualizations. The software also lets you run insights on insights.
All you have to do is to select a dataset from the Datasets tab. Select Get quick insights from the more options and Power BI will uncover insights in just a few seconds.
It’s only impossible to run quick insights on dataset uses that aren’t statistically significant.
Verdict
The data discovery process on SAS and Power BI is reliable. However, you can do more with SAS.
Visualizations
SAS

Visual Analytics is another exclusive feature of the SAS software. The Visual Analytics tool works as a single application for visual data exploration and reporting.
SAS Visual Analytics uses intelligent auto charting to produce the best possible visualizations for your data. The auto chart used will depend on the dataset and the tool works best when you’re dealing with big data.
Notably, SAS visualizations support location analysis so you can add geographical context. You can share your visualizations in different formats.
Power BI

Power BI features different visualizations. New visualizations are frequently added to the tool. You can add them to your BI reports or pin them to your dashboard.
Some of the supported visualizations include basic & stacked area charts, bar and column charts, multi-row cards, single number cards, combo charts, KPIs, doughnut charts, etc.
Notably, you can add different map types to your visualizations. This includes basic maps, Azure maps, ArcGIS maps, Shape maps, and Choropleth.
Verdict
This Power BI vs SAS feature comparison is a draw; both feature very good data visualizations.
Scheduling
SAS

For better time management, SAS lets you schedule tasks with ease. There are several scheduling options. The first option is to schedule tasks in a batch using SAS coding.
However, the most preferred option for scheduling tasks with SAS is via the Enterprise Guide tool. This Guide tool features a built-in scheduler so all you need to do is point and click.
You can schedule your entire project or individual process flows using the built-in scheduler. You can also schedule tasks using the SAS Management Console and Platform Suite.
Power BI

Power BI doesn’t feature any native scheduling tool. If you must schedule your tasks, you have to make use of the Power BI Reports Scheduler (PBRS) which is a third-party tool by ChristianSteven.
With the ChristianSteven PBRS tool, you can not only schedule tasks, but you can also select, filter, format, and distribute your Power BI reports.
The PBRS tool will only work on cloud and on-premises deployments. Furthermore, it’s a premium tool although you can use it free on trial before paying.
Verdict
Without a native scheduler, SAS wins Power BI on this one.
Interesting Post: How To Use Power BI On Mac
Security
SAS
As a SAS user, be rest assured that you’re using software with a security framework that incorporates industry best practices. To start with, the software is GDPR compliant.
All developers who create, test, and implement SAS features are trained in security issue identification and resolution.
Furthermore, SAS has a Product Security Incident Response Team (PSIRT) that looks into potential post-release security flaws and prioritizes incidents based on severity.
Power BI
Power BI is built on the Microsoft Azure platform which is very secure. Your uploaded data is stored to either the Azure Blob Storage or the Azure SQL database.
You must authenticate your identity via the Azure Active Directory to access data on any of these storage platforms. For secure network connection, enterprises have the option to enforce TLS (Transport Layer Security).
Other security features include multi-tenant environment security and networking security. Notably, the software allows you to add additional AAD-based security measures.
Verdict
SAS and Power BI are very reliable when it comes to security.
Collaboration
SAS
The SAS visual business analytics software is a highly collaborative one. This is supported via the SAS/SHARE server. Data shared to this server can be accessed by multiple users simultaneously.
There’s no need for separate SAS logins. The SAS/SHARE server works hand in hand with other SAS components for managing and coordinating requests.
With SAS, you can also directly share data files with other users. You just need to add the new user and grant them specific permission access. Alternatively, you can generate a link and send it to them.
Power BI
Collaboration in Power BI is supported via Microsoft Workspaces and Microsoft Teams. Via these platforms, you can work with other members of your team in real-time.
Power BI also lets you share and distribute your reports and dashboards easily. You can share your reports and dashboards from your Workspace or embed them on websites. Bundle reports can be sent to large groups.
Furthermore, you can easily turn your customized reports into templates and share them for others to use.
Verdict
You get more options for collaboration and sharing with Microsoft Power BI.
Explore: Best Power BI Alternatives For Mac
Integrations and APIs
SAS
Despite being a proprietary software, it’s easy to integrate SAS with several third-party platforms. SAS doesn’t feature any direct integration but, you can connect it with other platforms using the SAS Integration Technologies server.
The SAS Integration Technologies server features both APIs and standards-based communication mechanisms. It makes it easy for you to integrate SAS with different platforms and heterogeneous software systems.
SAS Integration Technologies lowers the cost of third-party web application servers while also making installation and upgrade administration easier.
Power BI
Connecting Power BI with other platforms is not difficult since the platform is open source. You’re good if you know how to code.
Power BI is a Microsoft product hence it easily integrates with other Microsoft products. You may not know but Microsoft has more than 100 products, services, and apps.
Notably, you can integrate Power BI with several other platforms via the Azure DevOps Server. Furthermore, there’s the Power BI Rest API.
Verdict
Both SAS and Power BI support integrations and APIs, although their pattern is different.
Mobile Support
SAS

Mobile BI is possible with SAS. The software supports Android, iPad, and iPhone. You can download the mobile app on their respective app stores.
The SAS mobile app has a user-friendly interface that makes it easy to use. You can create reports and visual analytics. It’ll work with any SAS file from the desktop or cloud solutions.
Furthermore, with the SAS mobile app, you can share your screen to the desktop.
Power BI

Power BI supports mobile business intelligence via mobile apps. You can download the mobile app on Android, iOS, and Windows mobile devices.
Hence, the app is featured in the App Store, Google PlayStore, and Microsoft Store. With the app, you can view live Power BI dashboards and reports.
Verdict
Power BI wins here due to support for Windows mobile devices.
Customer Support
SAS

SAS offers documentation, technical support, training, FAQ, and how-to videos to help users. You can directly contact the support team via phone, email, Twitter, or LiveChat. There’s also the SAS community where users can interact.
Power BI

With Power BI, there are different channels for getting support. The platform features exclusive support for America, Europe, and the Asia Pacific regions.
There are several resources including the documentation, report samples, guided learning, and the Power BI community.
Verdict
Customer support is reliable on both Power BI and SAS.
Pricing
SAS

To use SAS, you need to contact the sales team to discuss the pricing. You can reach them via phone or with a contact form. However, there is exclusive pricing for the Analytics Starter packages. This includes:
- SAS Analytics Pro – 10,170.00 USD per unit
- SAS Visual Data Discovery – 11,920.00 USD per unit
For both, the rate gets cheaper as the number of units increases.
Power BI

There are 2 different pricing plans with Power BI and they include:
- Power BI Pro – $9.99 per month per user
- Power BI Premium – $20 per month per user; $4,995 per month per capacity for organizations
Similarities & Differences
Similarities
- Both SAS and Power BI works for business analytics
- Both SAS and Power BI support desktop and mobile deployment
- They both support cloud, SaaS, and web deployment
- Both support ad-hoc reporting
- With either Power BI or SAS, you get support for various visualizations
- They are both secure tools
- Both support collaborations
- By using either SAS or Power BI, you get support for integrations
Differences
- Power BI is open source while SAS is proprietary
- SAS supports Linux and Windows while Power BI supports just Windows
- SAS features different scheduling options including the built-in enterprise guide schedule. Meanwhile, scheduling on PowerBI is only possible via a third-party tool.
- Power BI supports Windows mobile while SAS doesn’t.
Also Read: Qlik Sense vs Power BI
Pros & Cons
SAS Pros
- BI reports
- Easy ad-hoc reporting
- Visualizations
- Linux and Windows support
- Mobile support
- Easy data discovery
- Multi-scheduling options
- Reliable security
- Sharing and collaboration
- Integrations and APIs
- Android, iPad, and iPhone support
SAS Cons
- Expensive
- No direct integrations
Power BI Pros
- Open-source
- BI reports
- Data visualizations
- Automatic data discovery
- Reliable security
- Sharing and collaboration
- Integrations and APIs
Power BI Cons
- For Windows alone
- No native scheduler
- Android, iPad, Windows, and iPhone support
Also Read: Bad Data Visualization Examples
SAS vs Power BI – Which Is Better?
In terms of features, there’s almost nothing to separate SAS and Power BI because both tools are stacked. Nevertheless, SAS has more features especially when it comes to statistical methods.
Power BI lacks features like multivariate analysis, time series, trend & problem indicators, and regression analysis. SAS features these. The only major downside is that SAS is very expensive.
Tom loves to write on technology, e-commerce & internet marketing.
Tom has been a full-time internet marketer for two decades now, earning millions of dollars while living life on his own terms. Along the way, he’s also coached thousands of other people to success.