Microsoft released Power BI in 2011 as part of the Microsoft Power Platform. It is a business analytics platform that facilitates creating powerful data visualization and getting real-time business intelligence. The platform is highly scalable such that you can connect it with various data sources.
If you own a Mac computer, unfortunately, you cannot install Power BI. As a Microsoft product, the business analytics platform is only available for Windows on desktop. That doesn’t imply that you can’t use a business analytics tool on your Mac.
There are Power BI alternatives for Mac systems and I’ll be listing the 10 best ones.
10 Power BI Alternatives For Mac
1. Tableau

If you want a Power BI alternative for your Mac, look no further than Tableau. Unlike Power BI which is relatively general, Tableau is tailored for data analysts. Executives and IT staff can use the tool as well. This business intelligence tool focuses on three main parts of data management. This includes preparing data, analyzing/exploring data, and collaboration.
The Tableau desktop app lets you access quick actionable insights. You don’t have to worry about chart builders as the platform presents visual analytics by default and the dashboard is interactive so all insights are visible.
Just like Power BI, you can connect Tableau to different data sources including SQL databases, spreadsheets, and cloud platforms such as Salesforce and Google Analytics. Using data you collect, you can easily build powerful calculations in a simple drag and drop interface. The Device Designer lets you optimize your dashboard to suit tablet and mobile devices.
You can create maps with Power BI but it’s a lot better with Tableau. This is because Tableau creates maps automatically thanks to the built-in postal codes. There are postal codes from regions in over 50 countries around the world.

Another advantage of using Tableau is the AI-driven Explain Data feature. Instead of trying to find out data insights yourself, Explain Data will do the job by uncovering all data points. With Tableau, you can design a data environment for all players in your business to collaborate and share data visualizations.
2. Talend
Talend is a freemium and open-source Power BI alternative for Mac. The platform integrates data integration and governance giving you quick access to trusted data. It will work with cloud, multi-cloud, and hybrid data sources. Some top companies that use Talend include Toyota, Clt, Bayer, and Dominos.
As an open-source tool, you can do more with Talend than with Power BI if you’re a developer. With Talend, data integration is made very simple. It’s flexible such that the data pipelines you build can be run anywhere without the need for third-party vendors. The pipelines are also reusable.
With Power BI, you get access to prebuilt custom data connectors. Talend, on the other hand, features an easy UI for building these data pipelines faster and smarter. You can design and preview in real-time yourself without needing IT knowledge.
You can easily embed stewardship, preparation, and cataloging amongst others into your data pipelines. Talend also allows you to share data. An interesting Talend feature is the Trust Assessor. What this does is analyze your entire data structure to check its quality.
The Trust Assessor focuses on three main areas which are data validity, completeness, and uniqueness. It uncovers any bad data, even the tiniest bit.
As mentioned earlier, Talend is freemium. You can utilize its open-source version for free, but other advanced features are premium. You can try the Talend premium version for 15 days before paying.
Interesting Read: Best Power BI Books
3. LinceBi

LinceBi is another noteworthy Power BI alternative for Mac. It incorporates analytics and business intelligence tools just like Power BI.
The platform is compatible with Mac computers and Windows computers. It will work on tablets and smartphones as well. Plus, you can deploy it on cloud or on-premise locations.
LinceBi features a global business intelligence portal that draws data from multiple sources. You can use the platform with structured, semi-structured, and unstructured big data. It features multiple business intelligence tools so you can choose any you prefer.
With LinceBi, you don’t need technical skills. It has a user-friendly dashboard. Plus, it has several templates, just like Power BI.
With this Power BI alternative for Mac, you can conduct what-if analysis and mailing. The report builder is drag-and-drop and there are many advanced filters you can apply to integrate the exact data you want.

While monitoring data, LinceBi allows you to customize your KPIs. You can assign customized weights to KPIs and assign color coding to your data threshold. Power BI lets you set data alerts and so does LinceBi. In addition to data alerts, LinceBi also allows you to set different data rules.
Analytics reported by LinceBi are downloadable. You can download them in different formats including Excel, CSV, PDF, and HTML. You can also sync the reports with other users.
Also Read: Best Power BI Sales Dashboard Examples
4. QACube

This tool was developed as an analytics and quality reporting solution for complex enterprises. QACube is similar to Power BI as they both deliver data visualizations. While you can use Power BI free to an extent, QACube is a 100 percent premium and proprietary platform.
QACube provides enterprises with visual analytics and clear graphics to enable them to make business decisions based on facts. The process is fully automated and fast so there’s hardly a need for manual effort. The platform promotes data reliability by ensuring only quality information is tracked. You get to work with dynamic dashboards and you can assign roles for other users who access these dashboards.
Relatively, QACube dashboards are more customizable than Power BI’s. You can create your own views from scratch by using widgets; there are hundreds of widgets in the QACube portfolio. Building these dashboards is simple as you just need to drag and drop these widgets.
Other customization options include selecting a display specification, execution KPIs, and automation methods. You can embed visual data like bar graphs and pie charts in your dashboard and easily hide the metrics your enterprise finds irrelevant.
QACube is a recommended Power BI alternative for Mac if you need much integration. The platform natively integrates with platforms like Azure DevOps, Bugzilla, HP QC Enterprise, Jenkins, JIRA, Redmine, Microsoft Excel, Spira Test, XML, Xray, etc. Power BI does feature more integration.
Interesting Comparison: Qlik Sense Vs Power BI
5. Redash

With Redash, you make sense of your data. The platform recently joined Databricks which all but increased its business intelligence functionality. You can use Redash to connect data from various sources, create data visualizations, and share them with others. These are the basic functions of Power BI.
With Redash, you can draw data from Big Data, NoSQL, SQL, and API data sources. Unlike Power BI, Redash is open source so it can be highly customized to include more features using the API.
While Power BI comes with various data connectors, Redash features a powerful online SQL Editor. This editor is cloud-based so you can write your data queries faster and more efficiently. Data snippets you create can be reused and the SQL editor supports schema.

To create data visualization on your dashboard, Redash features a drag and drop editor like Power BI. Some of the data visualization types you can create with Redash include charts, cohorts, box plots, word cloud, counter, maps, funnels, pivot tables, and sunbursts, just like with Power BI.
The tool also allows you to schedule refresh from data sources so the visualizations stay up-to-date and you can easily share your visual dashboard with any member of your team. When sharing your dashboards, you can set different management levels for each user.
Similar to Power BI, Redash allows you to set up alerts so you’re notified whenever new data events occur.
Explore: Best Tableau Retail Dashboard Examples
6. Ubiq

Ubiq is a Power BI alternative for Mac that’s exclusive for MySQL and PostgreSQL. You can use it with local, remote, and cloud data sources. Ubiq is primarily web-based which is why it can be used on Mac.
Notably, Ubiq can work with any kind of data including website and app databases. It will also work with third-party applications like WordPress and Magento.
Analyzing data with Ubiq is not very different from using Power BI. You can create reports and visual dashboards easily, and analyze your data using drag and drop tools. Ubiq also features several filters and functions.
Other tools that are available to use include the MySQL chart builder, graph generator, report builder, and report generator. A notable tool is its KPI Dashboard. That way, you can create and track KPI dashboards.
Ubiq is an ideal Power BI alternative for amateurs because it doesn’t require any programming knowledge. Your dashboards will automatically update with any latest data even without you doing anything.
Your dashboard and data reports can be exported in different formats and you can share them with others in a very secure way. In addition to MySQL and PostgreSQL, you can build exclusive reports for databases like Amazon RDS and Amazon Redshift.
Ubiq cannot be used for free. There are five premium plans available depending on your data scale.
Check Out: Best Tableau Courses
7. Tercept
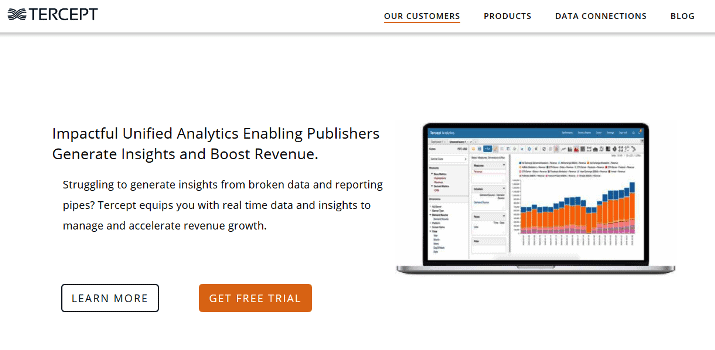
Tercept is a tool for publishers and digital marketers. It was developed to help generate insights that can boost revenue. Just like Power BI, it presents a unified analytics dashboard so you can view all your data from one place.
This Power BI alternative will work with any form of structured or unstructured data. You can manually upload your data or connect them from cloud platforms like Google Drive and Dropbox. Tercept can also draw data from FTP locations, emails, or from any website using the API.
Data you integrate using Tercept can be in any format including CSV, XLM, XLS, and JSON. Tercept creates data visualizations automatically, so you can spend less time preparing your dashboards. The pre-built dashboards are still very customizable.
If you’re an advertiser or affiliate marketer, Tercept is a Power BI alternative for Mac you should consider. The tool features data connectors for more than 100 top ad servers, networks, exchanges, and social media platforms.

Some of these include Amazon Affiliate, Bing Ads, Google AdWords, Google Adsense, Mgid, Instagram, and Revcontent. Tercept will help you get accurate reports for your revenue. You can directly optimize your campaigns to focus on important metrics like view-through conversions, CTR, viewability, and more.
Compared to other Power BI alternatives listed, Tercept is an advanced tool. The platform is premium and doesn’t offer any free accounts.
Also Read: Bad Data Visualization Examples
8. Zepto

Zepto is a much simpler business intelligence tool and analytics tool than Power BI, used by both small and big brands. The tool works in three basic steps; first, you upload your data, search for insights and finally, create a visual /dashboard to monitor your data.
Power BI and Zepto share a major similarity; they both work with structured data. If you’ve got unstructured data, you’ll have to transform it first before you can upload it to Zepto. The tool mainly accepts Excel and CSV data formats.
Searching for insights with Zepto is very simple. Thanks to the AI, you can ask the tool data questions in plain English and its search and present the related insight. The tool also features AI-powered forecasting and predictive models so you know the prospects of your business.
Although creating visual dashboards with Power BI isn’t difficult, it’s easier done with Zepto as you just need three clicks. Visual data on Zepto appears real and detailed because it uses a 3D VR Engine.
Zepto is a highly collaborative Power BI alternative for Mac computers. Data files, dashboards, and charts can be shared and accessed via a single source file. Compared to Power BI, Zepto doesn’t yet feature data connectors and alerts but these are among the upcoming features. Zepto is premium and you have three pricing plans to choose from.
Explore: Misleading Data Visualization Examples
9. Knowi

Knowi is an advanced tool for data engineers and revenue-generating teams amongst others. It’s a full-stack analytics platform with native support for cloud API and NoSQL data sources. You can integrate data from these sources with Power BI too.
With Knowi, you can integrate data from all these sources without needing ETL – extract, transform, and load. The platform can help you visualize, analyze, and share this data with anyone. You can deploy Knowi on cloud or on-premise locations. It features an advanced data engineering layer that makes deployment seamless.
Since it doesn’t require ETL, Knowi will work with unstructured and semi-structured data sources like MongoDB, Astra, InfluxDB, etc., and structured data sources like MySQL, SQL Server, Oracle, etc. In addition to that, Knowi will integrate with other sources like Salesforce, Google Sheets, Analytics, REST APIs, and Spark. You can upload data files too.

Both Power BI and Knowi support Natural Language Processing, Machine Learning, and Alerting. As a data engineer, you can use Knowi for white-labeled analytics. You can do this with Power BI too but it isn’t natively supported; you have to work your way around it.
Like Power BI and other alternatives mentioned, Knowi provides a single view of all your data. Plus, you get a real-time alert for every data change. With Knowi, you can collaborate with other team members but this requires a Slack or Microsoft Teams integration.
10. Snapboard

The last on this list of 10 best Power BI alternatives for Mac is Snapboard. Snapboard is mainly used on mobile devices as an app to monitor all business data. A native desktop app is available for Windows and Mac computers.
Snapboard pulls data from various sources. Unlike Power BI, these sources are mainly social and marketing apps. Power BI supports more database sources than Snapboard. The database sources Snapboard supports are just Firebase, MongoDB, Redis, and Postgres.
Other platforms where you can draw data for Snapboard include Facebook, YouTube, MailChimp, Trello, Stripe, Google Analytics, Stripe, and Google Search console amongst others. The platform natively integrates with all these platforms.
Building your dashboard with Snapboard is easier than with PowerBI. The platform is relatively less technical than Power BI. This is because you just have to create cards for any application whose data you want to track.
There are predefined templates that you can simply edit. You can selectively make your dashboards public or private. Private dashboards can only be viewed by you while public dashboards can be viewed by you and your team members.
Snapboard and Power BI are both premium platforms. You can use the Snapboard free account forever but it only tracks data for 30 days and updates your dashboard every 15 minutes. The pro and enterprise versions let you do more.
Final Note
Power BI is one of the best analytics and business intelligence platforms available today. As a Mac user, you can go with any of the 10 alternatives listed in this article because Power BI doesn’t support your Mac system.
Tableau is the best alternative to Power BI for Mac users. It is premium, but if you need a free alternative, Talend is recommended.
Tom loves to write on technology, e-commerce & internet marketing.
Tom has been a full-time internet marketer for two decades now, earning millions of dollars while living life on his own terms. Along the way, he’s also coached thousands of other people to success.